Google Analytic

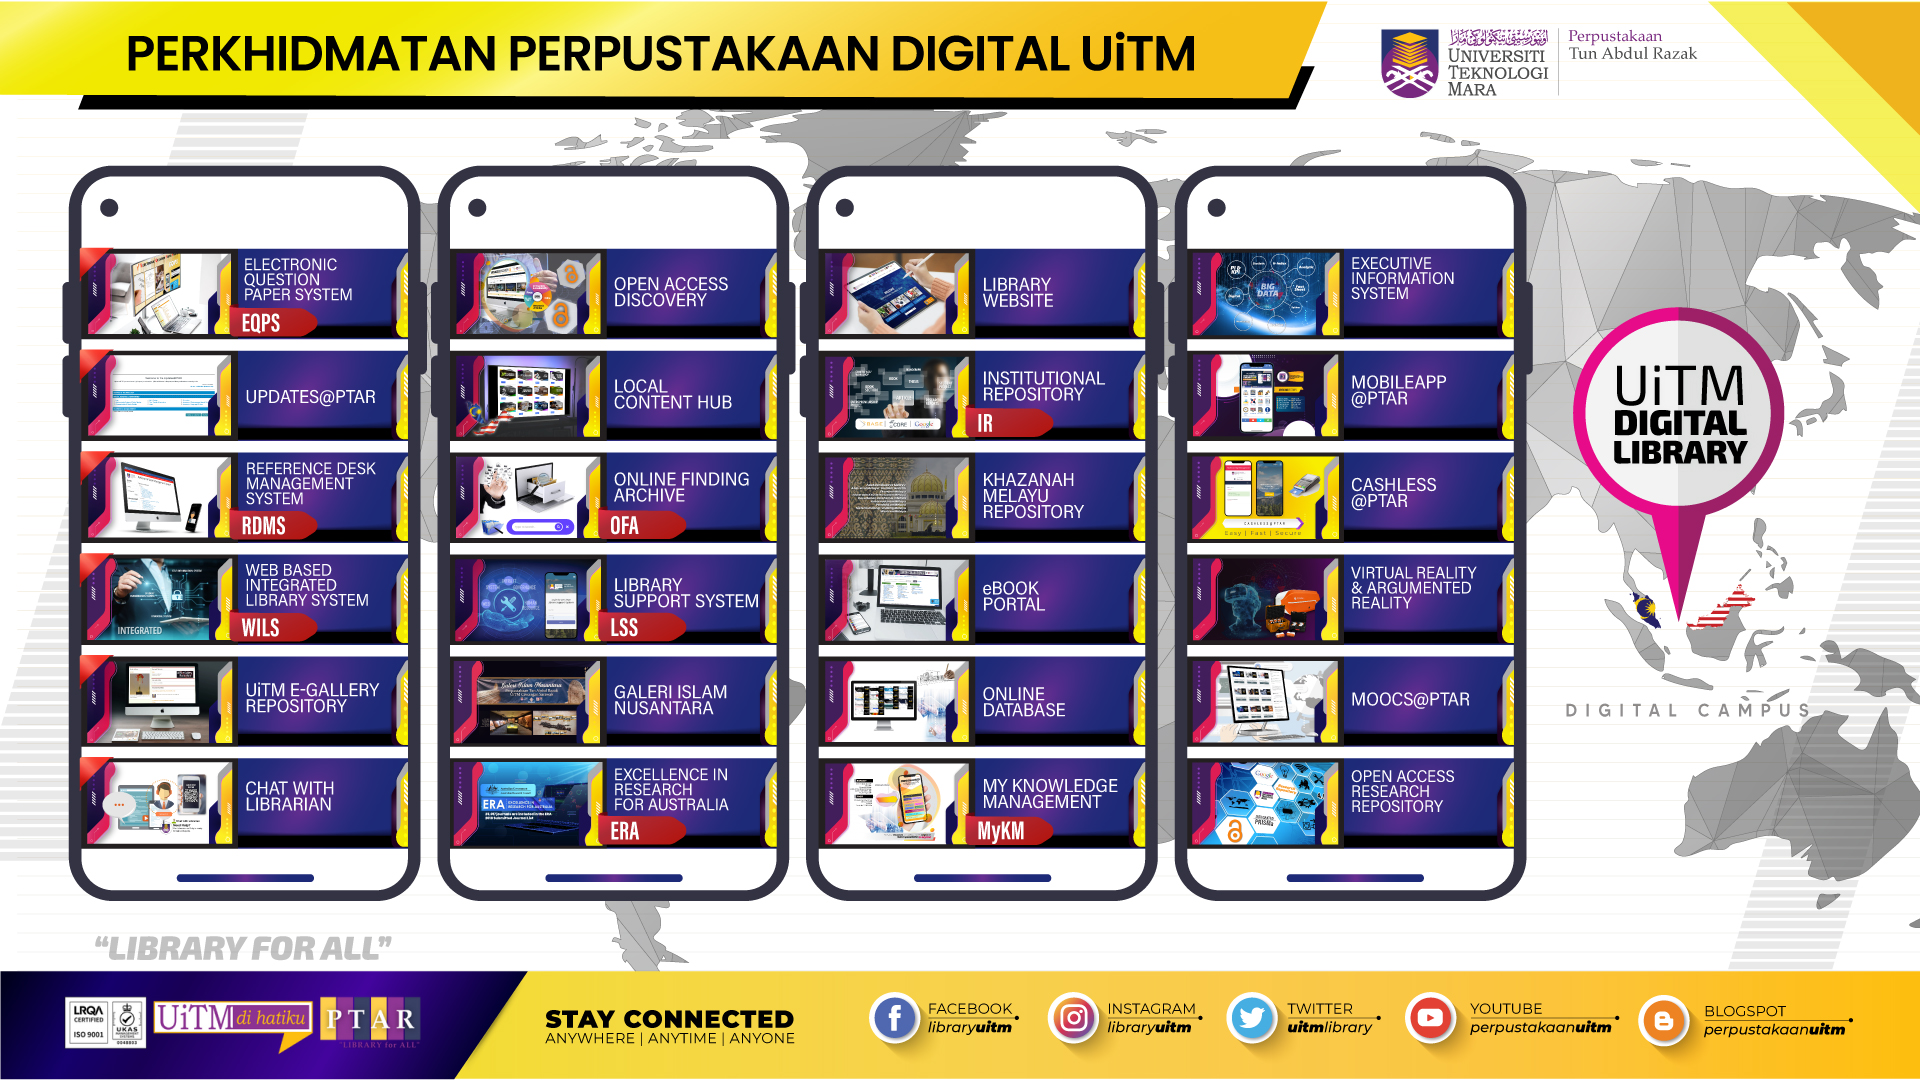
Perpustakaan Digital UiTM

Infografik 3 komponen utama Model perpustakaan digital UiTM.

Repositori UiTM

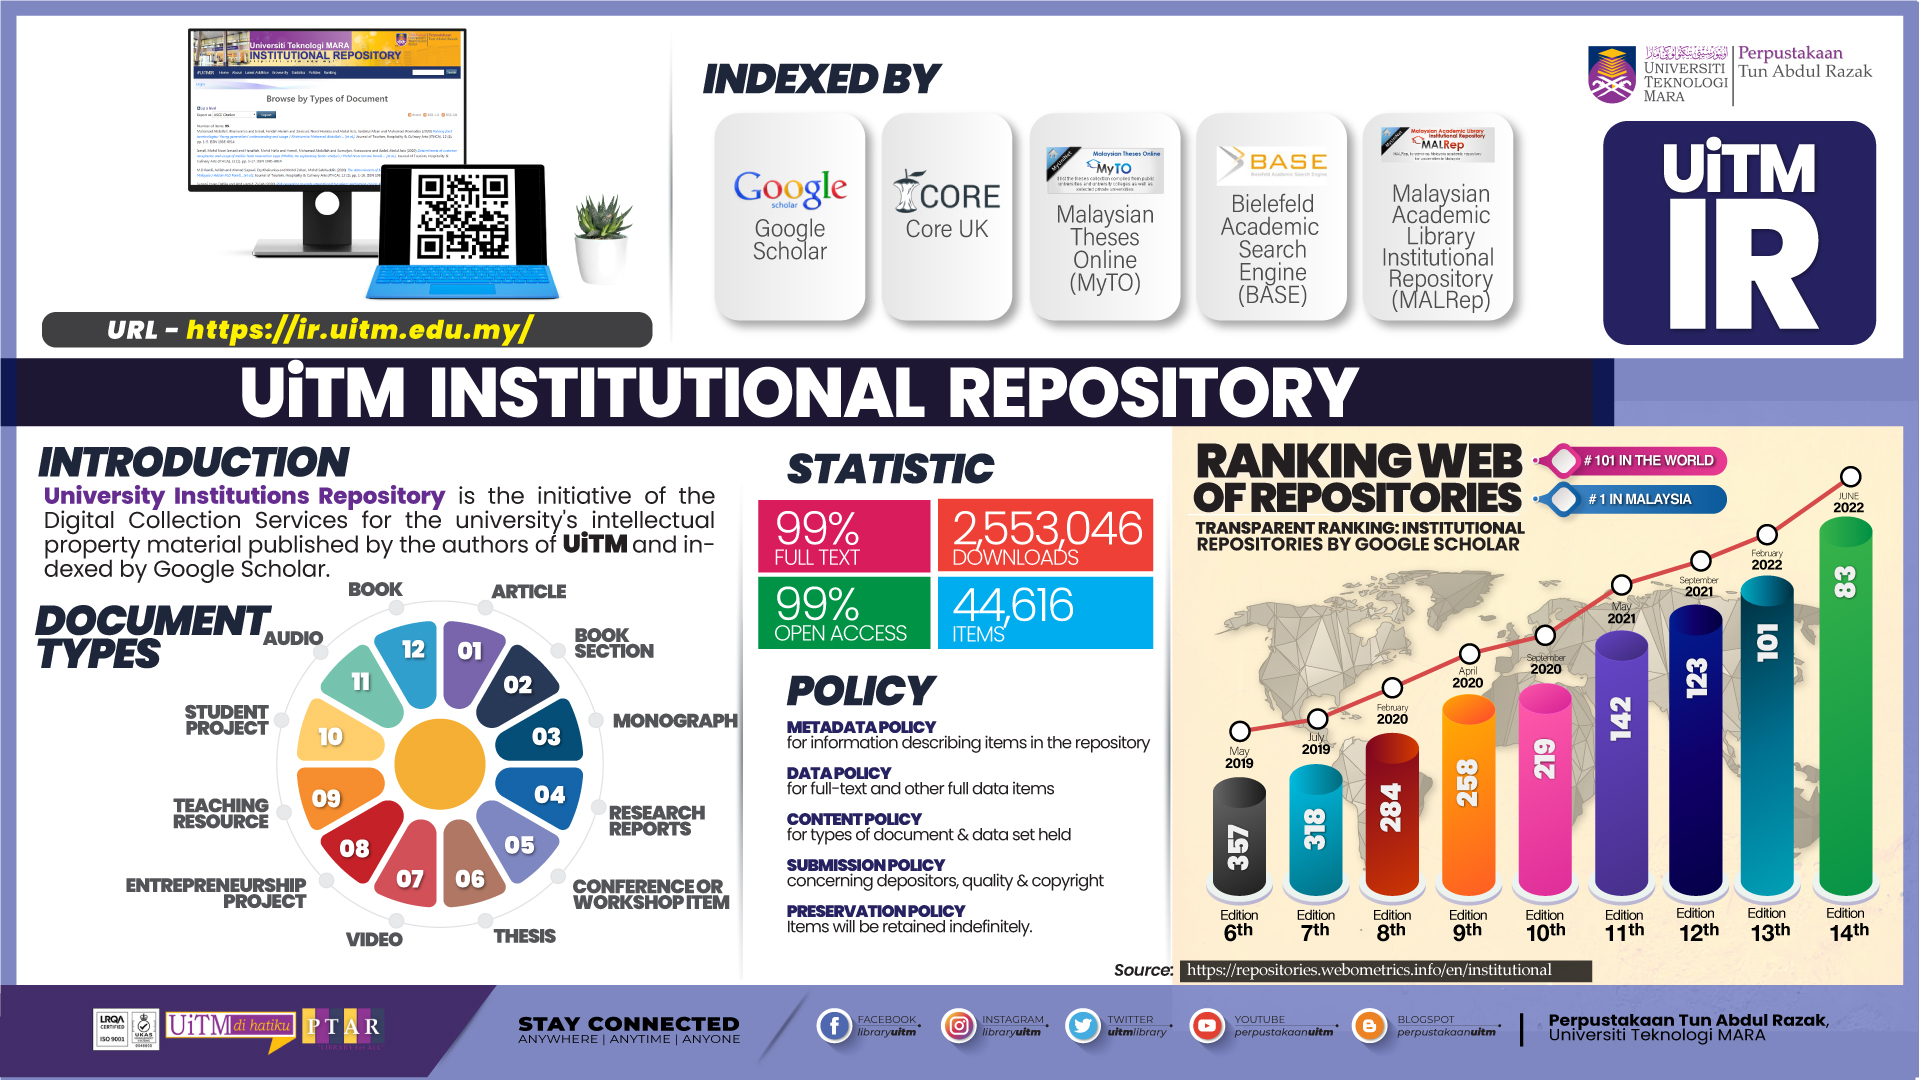
The repository is a platform that contains sources of reference materials for learning and research purposes. The UiTM Library provides three repositories that provide a collection of digital materials through the repository of university institutions, Open Access and Local Content Hub.

My Knowledge Management

MyKM Portal provide the complete information search, categorization and personalization services that allow UiTM Library users to harness the collected enterprise knowledge assets from a single, logical point of access.

UiTM Institutional Repository

UiTM IR is a centre of digital collections, act as an open-access repository that collects, preserve and disseminates scholarly output by university members at Universiti Teknologi MARA.

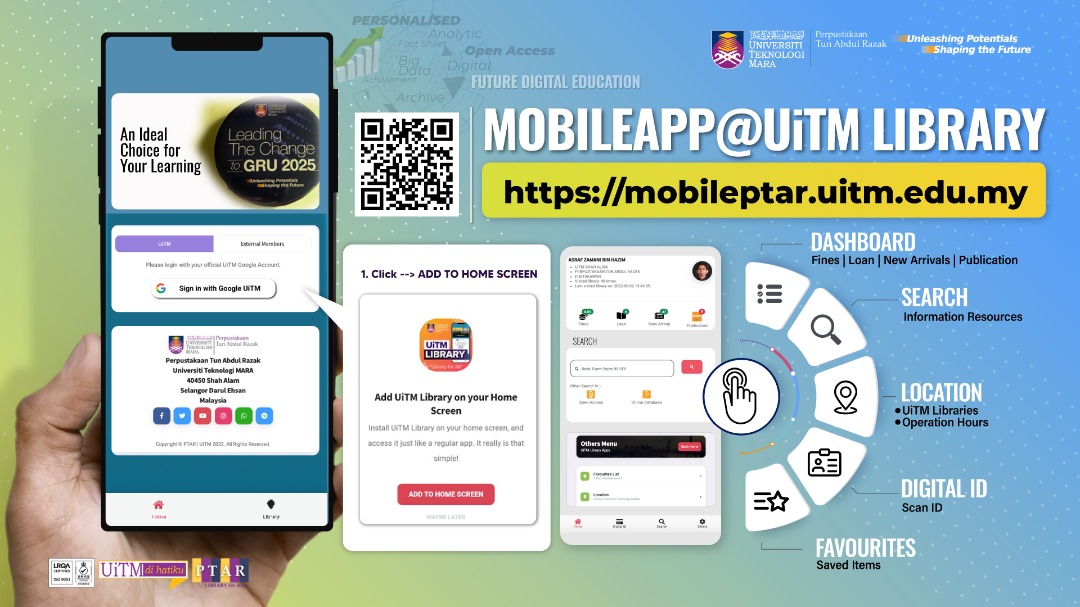
UiTM LIBRARY MOBILE APP

With the mobile app, you can access information wherever you are and whenever you want to get the latest information on our library, access e-resources and many more.

UiTM DIGITAL SERVICES

22 UiTM Digital Services

Tuesday, August 16, 2011

Difference Between Speed vs Bandwidth.....The Age Old Question

Bandwidth

Bandwidth vs Speed

Bandwidth is a very old term that predates the advent of computers and all other digital technologies. It is widely used in analog technologies like radio transmission, acoustics, and many others. In computing, bandwidth is often used to indicate the amount of data that is being, or can be, transferred at a given time. This is often measured in bits per second with common values expressed in thousands (kilobits per second), millions (megabits per second), and in billions (gigabits per second). Speed is simply a description of how fast things can be done. In computing, speed and bandwidth are often used interchangeably since they often mean the same thing.

A very good example when bandwidth would directly correlate to speed is when you are downloading a file across the network or Internet. Greater bandwidth means that more of the file is being transferred at any given time. The file would be therefore be downloaded faster. This is also applicable when you are browsing the Internet as greater bandwidth would result in web pages loading faster and video streaming to be smoother.

But in certain cases, speed and bandwidth do not literally mean the same thing. This is true when you talk about real time applications like VoIP or online gaming. In these cases, latency or response time is more important than having more bandwidth. Even if you have a lot of bandwidth, you may experience choppy voice transmission or response lag if your latency is too high. Upgrading your bandwidth would probably not help since it would no longer be used. Latency can’t be upgraded easily as it requires that any noise be minimized as well as the amount of time that it takes for packets to move from source to destination and vice versa.

To obtain the best possible speed for your network or Internet connection, it is not enough to have a high bandwidth connection. It is also important that your latency is low, to ensure that the information reaches you quickly enough. This only matters though if you have enough bandwidth as low latencies without enough bandwidth would still result in a very slow connection.


Summary:

1. Bandwidth is a measurement of how much data can be transferred at a time while speed is a measurement of how fast things are done

2. Bandwidth and speed can be synonymous when measuring how fast you can download a file

3. Bandwidth may not directly translate to speed in real time applications


VIA

http://www.differencebetween.net/technology/internet/difference-between-bandwidth-and-speed/

http://broadband-nation.blogspot.com/2007/06/speed-vs-bandwidththe-age-old-question.html

------------------------------------------------------------------------------------------------------------

One of the most commonly misunderstood concepts in networking is speed and capacity. Most people believe that capacity and speed are the same thing. For example, it's common to hear "How fast is your connection?" Invariably, the answer will be "640K", "1.5M" or something similar. These answers are actually referring to the bandwidth or capacity of the service, not speed.

Speed and bandwidth are interdependent. The combination of latency and bandwidth gives users the perception of how quickly a webpage loads or a file is transferred. It doesn't help that broadband providers keep saying "get high speed access" when they probably should be saying "get high capacity access". Notice the term "Broadband" - it refers to how wide the pipe is, not how fast.

Latency:

Latency is delay.

For our purposes, it is the amount of time it takes a packet to travel from source to destination. Together, latency and bandwidth define the speed and capacity of a network.

Latency is normally expressed in milliseconds. One of the most common methods to measure latency is the utility ping. A small packet of data, typically 32 bytes, is sent to a host and the RTT (round-trip time, time it takes for the packet to leave the source host, travel to the destination host and return back to the source host) is measured.

The following are typical latencies as reported by others of popular circuits type to the first hop. Please remember however that latency on the Internet is also affected by routing that an ISP may perform (ie, if your data packet has to travel further, latencies increase).


Ethernet                  .3msAnalog Modem              100-200msISDN                      15-30msDSL/Cable                 10-20msStationary Satellite      >500ms, mostly due to high orbital elevationDS1/T1                    2-5ms

Bandwidth:

Bandwidth is normally expressed in bits per second. It's the amount of data that can be transferred during a second.

Solving bandwidth is easier than solving latency. To solve bandwidth, more pipes are added. For example, in early analog modems it was possible to increase bandwidth by bonding two or more modems. In fact, ISDN achieves 128K of bandwidth by bonding two 64K channels using a datalink protocol called multilink-ppp.

Bandwidth and latency are connected. If the bandwidth is saturated then congestion occurs and latency is increased. However, if the bandwidth of a circuit is not at peak, the latency will not decrease. Bandwidth can always be increased but latency cannot be decreased. Latency is the function of the electrical characteristics of the circuit.

via

http://www.dslreports.com/faq/694


------------------------------------------------------------------------------

About Bandwidth

Internet bandwidth is, in simple terms, the transmission speed or throughput of your connection to the Internet. However, measuring bandwidth can be tricky, since the lowest bandwidth point between your computer and the site you're looking at determines the effective transmission speed at any moment.

Three factors outside of your computer control how quickly you can view Web pages:

  1. The Internet bandwidth between your computer and the site you're viewing.

  2. The round-trip time between your computer and the site you're viewing.

  3. The response time of the site you're viewing.

The tests referenced on this page address the first issue, and measure the Internet bandwidth between your computer and PC Pitstop's servers. We also have tests that can measure the round-trip time between your computer and seven different sites on the Internet, here. Of course, the response time of our site will always be wonderful...:) (If not, we'll tell you on the home page.)

Tests: Download vs. Upload

The differences between our Download and Upload tests aren't as obvious as they may initially seem. Yes, the basic difference is the direction of the data transfer: Simply put, the Download test measures your connection speed for viewing Web pages; the upload test measures the speed for maintaining them--or sending data over your connection.

However, the rated upload and download speeds may not be the same for your connection. Some connections, such as 33K and lower, are "symmetric," meaning the rated upload and download times should be the same. Other connections, such as cable modems and ADSL, are "asymmetric" (the "A" in ADSL stands for asymmetric). This means the upload and download times won't necessarily be the same; upload times are generally not as fast as download times. For instance, the rated speeds for ADSL are 1.4Mbps down, and 400Kbps up. Cable modems are typically rated at 1.5 to 3Mbps down, and 400 to 600Kbps up.

Occasionally, you may even see opposite results, especially on cable modems during the evening hours. If your connection has a heavy user load, the download times may suffer, while the upload times remain unchanged. This is because the majority of Internet users download data instead of uploading it.

Bottom line: You should regularly run our bandwidth tests to make sure you're getting the rated upload and download speeds from your connection.

About throughput and reproducibility

The Internet changes from one moment to the next in ways that are impossible to predict. You cannot expect to see the same bandwidth value every time you measure it. Furthermore, you cannot expect to see the full nominal speed of your connection for your bandwidth measurement: There are always delays somewhere. As a rule of thumb, if you can measure throughput that is 85% of your nominal bandwidth, more often than not your connection is performing at par. (You may need to contact your service provider or modem manufacturer to determine the rated speed of your connection and/or modem.)

This is especially true with modems. Most 56Kbps modems connect at a speed less than 46Kbps, because of the limitations of analog phone lines and telephone company switches.

To get the best picture of your Internet bandwidth, test several times. Also test at different times of the day: Your bandwidth measurement at 7 AM may be much better than your bandwidth measurement at 10 PM.

About bandwidth units

You will often see bandwidth and transfer speed quoted in two different units: kilobits per second, abbreviated kbps or Kb/s, and kilobytes per second, abbreviated KB/s. The difference between the two units is the number of bits in a byte, which is 8. The small 'b' stands for bits, and the big 'B' stands for bytes. Transfer speeds are often shown in KB/s, and connect speeds are usually quoted in Kb/s.

So, for instance, if a progress dialog for a modem shows you a download speed of 4.3 KB/s, it is the same as 34.4 Kb/s. If a progress dialog for a cable modem shows you a transfer speed of 100 KB/s, it is the same as 800 Kb/s.

We display our measured transfer speeds in Kb/s, to make them easier to compare with your rated line speed.

About bandwidth and modems

Bandwidth over a modem connection can sometimes be difficult to understand. There are two connections to a modem: one from your computer to its modem, and one from the computer's modem to the ISP's modem.

The connection speed between the computer and its modem (called the Maximum speed under Control Panel/Modem/General tab/Properties) should be set as high as possible without causing errors. On most computers this is 115200, also written as 115.2 Kb/s.

The connection speed between your modem and the ISP's, and the compression and error checking, are negotiated between the two modems when they establish the call. In the very best possible case, which is rarely seen, two V.90 (56 Kb/s) modems will be able to connect at 53 Kb/s with compression, and the compression on normal text transfer will average 50%, giving an effective transmission rate of 106 Kb/s. Very highly compressible material could be transferred at the maximum rate of 115.2 Kb/s. Incompressible material like ZIP files could be transferred at a maximum rate of 53 Kb/s.

Our download test transmits an incompressible block of random text. The theoretical maximum transfer speed for this over a V.90 modem is 53 Kb/s, if there was no latency at all on the line--that is, if there was no delay between the times your computer asked for a packet, our computer sent it, and your computer received it. With normal latency, however, transfer speeds are reduced to roughly 85% of the maximum, which for a V.90 modem would be about 45 Kb/s. If your modem connects to your ISP at the more typical 44 Kb/s, then you can expect our 

via

http://www.pcpitstop.com/internet/bandwidth_about.asp

-----------------------------------------------------------------------------------

Bandwidth (computing)

In computer networking and computer science, bandwidth,[1] network bandwidth,[2] data bandwidth,[3] or digital bandwidth[4][5] is a bit rate measure of available or consumed data communication resources expressed in bits/second or multiples of it (kilobits/s, megabits/s etc.).

Note that in textbooks on wireless communications, modem data transmission, digital communications, electronics, etc., bandwidth refers to analog signal bandwidth measured in hertz—the original meaning of the term. Some computer networking authors prefer less ambiguous terms such as bit rate, channel capacity and throughput rather than bandwidth in bit/s, to avoid this confusion.In computer networking and computer science, bandwidth,[1] network bandwidth,[2] data bandwidth,[3] or digital bandwidth[4][5] is a bit rate measure of available or consumed data communication resources expressed in bits/second or multiples of it (kilobits/s, megabits/s etc.).

Note that in textbooks on wireless communications, modem data transmission, digital communications, electronics, etc., bandwidth refers to analog signal bandwidth measured in hertz—the original meaning of the term. Some computer networking authors prefer less ambiguous terms such as bit rate, channel capacity and throughput rather than bandwidth in bit/s, to avoid this confusion.


This table shows the maximum bandwidth (the physical layer net bitrate) of common Internet access technologies. For a more detailed list see list of device bandwidths, bit rate progress trends and list of bit rates in multimedia.

56 kbit/s Modem / Dialup
1.5 Mbit/s ADSL Lite
1.544 Mbit/s T1/DS1
10 Mbit/s Ethernet
11 Mbit/s Wireless 802.11b
44.736 Mbit/s T3/DS3
54 Mbit/s Wireless 802.11g
100 Mbit/s Fast Ethernet
155 Mbit/s OC3
600 Mbit/s Wireless 802.11n
622 Mbit/s OC12
1 Gbit/s Gigabit Ethernet
2.5 Gbit/s OC48
9.6 Gbit/s OC192
10 Gbit/s 10 Gigabit Ethernet
100 Gbit/s 100 Gigabit Ethernet


http://en.wikipedia.org/wiki/Bandwidth_(computing)


--------------------------------------------------------------------------------------------


The Bandwidth Debate: Video and Net Neutrality

Video is creating huge increases in bandwidth usage. It currently generates more traffic in the US than was transmitted across the entire Internet backbone in 2000. While the Internet is not about to collapse, as video becomes the primary online delivery vehicle for entertainment, news and sports, the system will strain.

The Bandwidth Debate report analyzes the impact of the growth of online video content on the Internet transmission backbone, its availability and cost.

Looking at the future of the Internet, none of the players seem happy. ISPs insist that the costs of building out Internet capacity should not fall solely on them. Further, the proliferation of professional video content online—mainly TV shows and full-length movies—threatens the business model of cable companies, who are also major ISPs in most of the US.

On the other hand, companies invested in the TV business (networks, studios and cable providers) as well as major Internet players (Google, Microsoft and Yahoo!) and smaller sites all hope to carve out a share of the potential profits of video—and they are nervous, too.

In that light, the debate over network or Internet neutrality—Net neutrality, for short—is a power play, with involved parties using bandwidth issues as negotiating tactics for divvying up the pie.

Of course, as corporations scramble, consumers could be collateral damage. That is because several ISPs are looking to limit their customers’ bandwidth usage through techniques such as monthly download caps (often called throttling) and differentiated service tiers. The problem could even spill over to online video and advertising.


Monthly Consumer Internet Traffic Worldwide, by Segment, 2006-2012 (petabytes)

Key questions “The Bandwidth Debate” report answers:

  • How does the growth of online video shape the Net neutrality battle?
  • How much does video strain bandwidth capacities?
  • How could changes in ISP service offerings hurt online advertising?
  • How will government involvement affect Internet service offerings?
  • Can the ground rules for Internet usage be clarified?
  • And many others…
  • eMarketer Reports—On Target and Up to Date

    The Bandwidth Debate report aggregates the latest data from international technical, marketing and communications researchers with eMarketer analysis to provide the information you need to make smart, timely business decisions.    

    via

    http://www.emarketer.com/Reports/All/Emarketer_2000535.aspx


    OTHER TOPIC RELATED


    Internet-speedtest

    http://www.speedtest.net/

    Internet-speed
    Internet-highspeed

    http://blogs.cisco.com/news/global-internet-expansion-who-will-lead-the-way/

    http://blogs.cisco.com/tag/internet-traffic/

    http://blogs.cisco.com/news/global-internet-expansion-who-will-lead-the-way/


    Friday, August 12, 2011

    SESI FOTOGRAFI SUASANA HARI RAYA 2011 JPSTM, PTAR, UiTM, PART 1

    Semalam kami terima email meminta semua staf JPSTM memakai baju raya ...lelaki lengkap dengan sampin dan songkok hitam ........wanita lengkap dengan baju kurung........khas bergambar berhari raya ...masa kul 8.00 pagi...tempat di Lokasi Pameran di dalam PTAR1... bergaya depan kamera ala ala model gitu... haaa...so inilah model-model JPSTM... foto dibawah adalah bahagaian pertama nantikan bahagian kedua...puasa baru 12 hari bahang raya telah terasa....

    Perbincangan Keperluan Integrasi antara sistem di PTAR dan sistem SIMS UiTM

    Satu perbincangan tentang keperluan intergrasi bagi data pelajar dan staff  dengan sistem di PTAR seperti ILMU, EQPS, EZacces melalui ezproxy telah diadakan di meja perbincagan JPSTM  

    Data pelajar ini secara keseluruhan hampir 160,000 (pelajar seluruh UiTM) .

    Antara yang hadir wakil dari PSMB dan PTAR

    2011-08-11_11

    Thursday, July 28, 2011

    A Fantastic Reading List on e-books and e-readers in libraries

     
    Alatechsource
    Submitted by Daniel A. Freeman on July 26, 2011 - 8:30am
    Via :http://www.alatechsource.org/ 

    On August 4 and August 11, Sue Polanka will present the two-part Workshop, Integrating E-Books and E-Readers into Your Library. Our workshop presenters recommend advance readings to encourage learning and focused discussion. Whether you're planning to attend this event or not, check out the reading list Sue has put together--it's a fantastic overview of what librarians need to know about e-books and e-readers right now. You can register for this workshop, at either an individual or group rate at the ALA Store.


    Session 1: Purchasing eBooks for Libraries 

    Acquiring eBooks by Lisa Sibert and Carolyn Morris from No Shelf Required: E‐Books in Libraries by Sue Polanka, pages 95‐124 http://www.alaeditions.org/%20No_Shelf_Chapter_6
    Collection Development for E-Books  (E-Book Task Force Tip Sheets) by Anne Behler. 
    http://www.ala.org/ala/aboutala/offices/oitp/ebook_collection_dev.pdf

    What libraries can do when they buy an ebook
    http://blog.librarylaw.com/librarylaw/2011/06/what-libraries-can-do-when-they-buy-an-ebook.html

    Ebook Summit: Our Ebook Challenge http://www.libraryjournal.com/lj/home/887220-264/ebook_summit_our_ebook_challenge.html.csp

    OSLA: eBook Feasibility Study for Public Libraries
    http://www.cosla.org/documents/COSLA2270_Report_Final1.pdf

    E‐book Distributors for the Public and School Library Markethttp://www.booklistonline.com/ProductInfo.aspx?pid=3070294

    In Survey of Academic Librarians and Ebooks, Pointers Toward a Better System 
    http://www.libraryjournal.com/article/CA6722546.html

    Off The Shelf: eBook Aggregators http://www.booklistonline.com/ProductInfo.aspx?pid=2710528 


    Session 2: Lending eBook Readers in Libraries 

    May a Library Lend eBook Readers? Peter Hirtlehttp://blog.librarylaw.com/librarylaw/2010/06/may-a-library-lend-e-book-readers.html

    E‐Readers and Libraries by Beth Bouwman

    The River Forest Public Library Experience with the Kindle by Blaise Dierks from No Shelf Required: E‐Books in Libraries by Sue Polanka , pages 68 ‐69http://www.alaeditions.org/files/NoShelfRequired_68-69.pdf

    The Penn State University SONY E‐book Reader Project by Anne Behler, from No Shelf Required: E‐Books in Libraries by Sue Polanka, pages 88 – 90 
    http://www.alaeditions.org/no-shelf-required-pages-88-90 

    For reference: 

    Facebook Page – Ebook Readers in Libraries http://www.facebook.com/group.php?gid=14473239090#!/group.php?gid=14473239090&v=info

    Kindles at the Unquiet Library http://theunquietlibrary.libguides.com/kindles

    eReaders Home Page – Duke University Libraries http://library.duke.edu/ereaders/

    Times Higher Education - The research lab in your pocket

    The research lab in your pocket

    28 July 2011

    Apps created by and for the academy could turn smartphones into essential academic tools for everything from teaching and citations to social-science fieldwork. Sarah Cunnane reports


    The research lab in your pocket
    Credit: Bruno Mallart/Getty


    When George MacKerron set out to investigate how people's happiness is affected by their environment, he hit upon the idea of using mobile phones. What if an application could be developed to ask study participants - at regular intervals - how they were feeling, where they were and who they were with?

    The research project Mappiness does just that via an app that beeps phone owners once or more a day to enquire about their state of mind while simultaneously taking a noise measurement and tracking the participant's location with global positioning system technology. Richard Layard, the British economist and Labour peer known for his research on well-being, has described the project as "a revolutionary research idea", but for MacKerron, the concept was obvious.

    "The technology was there: it seemed a no-brainer," says the PhD researcher at the London School of Economics.

    What took MacKerron by surprise was the scale of the response. At the start of the project, he and his supervisor Susana Mourato had a "crazy pipe dream" that it might be possible to get as many as 3,000 people to volunteer to participate in the project. Instead, to date nearly 43,000 people have experienced "the warm glow of helping increase the sum of human knowledge", in the words of the Mappiness website.

    It is now nearly four years since Steve Jobs, co-founder and chief executive of Apple, announced that his company would be allowing third-party mobile apps to be developed for its newly released iPhone.

    At the time, he predicted the move would lead to "hundreds of new applications" for iPhone owners, but this too proved to be something of an underestimate: today, almost 500,000 different apps are available for download on iTunes.

    Thanks to apps, it is now possible to play Sonic the Hedgehog or read Times Higher Education on your mobile device. You can even turn your phone into a virtual pint of beer or a Star Wars lightsabre if that is what your heart desires.

    As apps have grown in popularity, there has been an increase in the use and discussion of such software within the academy. As well as research, apps are being used by academics to help with teaching and administration, and as a new way to engage with the public. Rob Spence, associate head of the department of English and history at Edge Hill University, has discovered a series of apps that help him manage his busy week.

    One, called Evernote, allows him to keep track of notes and interesting titbits that he picks up throughout the day.

    "I was forever scribbling down notes on bits of A4 paper and then losing them and thinking: 'I'm sure I wrote something down about that,'" he says.

    Evernote allows users to take "notes" in the form of sounds, pictures, text, websites or even handwritten sentences that can then be sorted into folders, tagged and edited.

    The benefit, Spence finds, is being able to keep on top of things that may prove relevant at a time when people are being "bombarded with education".

    "It's a question of filtering and organising, and this is a good way of doing it," he says.

    Another app that has proved useful for academics is Dropbox, which Spence says is currently "flavour of the month".

    Dropbox uses cloud computing to allow file synchronisation. Put more simply, it allows users to save a file to a folder that can then be accessed at any other computer with Dropbox installed. This provides a secure and accessible way to store files without relying on a physical (and easily lost) USB (universal serial bus) stick, or the need constantly to email oneself updated versions of the same documents.

    "It's great - just on the very simple level of being able to save your precious documents in a remote place you can access at any point," Spence enthuses.

    Steve Greer, lecturer in drama, theatre and performance at Aberystwyth University, also uses Dropbox, and says that the app is helping to make him more productive.

    "It is particularly useful being able to save things I want to read into my folder and synchronise before I go anywhere," he explains. "It means I can catch up on reading on, say, a train. It makes me far more productive on my journeys."

    Greer has also found value in using an app called Quick Cite when writing papers. Quick Cite allows users to take pictures of books' barcodes. An email is then sent with the book's citation, which can be recorded in American Psychological Association, Modern Languages Association, Chicago or Institute of Electrical and Electronic Engineers styles.

    "I now scan books I read automatically, so I've got a subfolder in my email when I go to write a journal paper or organise my teaching," Greer says. "It's like my own personal archive."

    Despite this, Greer feels that academics do not always appreciate the opportunities offered by apps, even if they own smartphones.

    "I think there are a lot of people walking around with these phones in their pockets who don't understand what they are capable of doing," he says.

    Even if scholars are not using the technology, they still need to be aware of the culture shift caused by the use of advances such as apps and smartphones, argues Alec Hosterman, senior lecturer in communication arts at Indiana University South Bend.

    "The nature of technology is such that something will come along in five years or so and we will forget about apps. However, I think that what these apps are doing is changing our cultural perception of the interface between user and device."

    Peter Abrahams, professor of clinical anatomy at the University of Warwick, understands the potential of apps without feeling the need to use them himself. Abrahams is the star of Aspects of Anatomy, an iPhone and iPad reference app that combines videos, quizzes and written information on the chest and upper limbs.

    The app came about when Abrahams was looking for a way to preserve plastinated specimens that he had bought from the German anatomist Gunther von Hagens with a £500,000 grant.

    "If you handle the specimens too much they deteriorate over time quicker than if you do not," he says. "These specimens have got to last a long time because we're not going to get another half a million from anyone in the next 10 years, that's for sure."

    Abrahams made a series of video podcasts of the specimens. This in turn led to the development of an app that has become a hit with time-starved medical students. The portable format and short videos and quizzes allow them to study on the move or in coffee breaks.

    Abrahams believes that the success of his app shows there is scope for academics in other fields to develop something similar. But he adds a caveat: "They need to think about how they do it. In anatomy, a lot of the apps have just been people taking pictures of flashcards and sticking them up. It's pathetic. These types of app are not using the medium at all."

    He also advises those thinking of building an app to have their material fully prepared before they go to see an app developer. This, he says, will enable academics to ensure that their vision for the app is realised.

    "I have had total control over the app and I wouldn't have done it if I hadn't had that, because it's me and my reputation on the line."

    Abrahams has ensured that any profit made from the app will directly benefit his surgical training suite, showing that a successful app could also become a new source of funding for academics or departments.

    Abrahams' app cost somewhere in the region of £20,000 to develop. Ken Punter, digital and online communications manager at Warwick, says that the university has learned from this experience, and has now moved to building apps in-house because it is more cost-effective.

    Warwick Writers, an app that contains more than 40 years' worth of audio recordings of authors reading from and discussing their work, has become the first product to come out of the university's in-house app-building team, and is designed to be a resource for students, academics and the public. Punter says that app building at Warwick will continue to bridge teaching and public engagement in the same way.

    "At the moment in higher education there is no hard and fast approach to how to use apps. Our approach has been that on one hand we can supplement our teaching; on the other, we can use apps to build brand awareness of Warwick," he says.

    Building awareness of an institution and a course was also the reason behind the development of an app at Coventry University that allows members of the public to participate in a second-year module in photography called Picturing the Body.

    The app, called #picbod, integrates tweets, photographs and podcasts, and allows people who are interested to follow the course in "real time" or at their own convenience.

    Matt Johnston, teaching assistant in photography at Coventry, explains that the module has a presence on Facebook, Twitter and Flickr, as well as its own website, but adds that the app has the ability to pull all this disparate information together.

    "Sometimes you think there's all this great content but it's dotted around in slightly different places. We had all this great stuff going on and all of that information comes to one space in the app - it's a hub."

    The added benefit of reaching out to more people through an app, Johnston says, is that it allows the 25 to 30 students on the course to gain experience and knowledge from some of the thousands of people who choose to interact with the module.

    "Having that pool of knowledge is just great," he says.

    The department plans to run the module again, beginning in February 2012, and plans have already been made for the development of another module - Photography and Narrative, or #phonar - in app form.

    Johnston advises that good content is essential to making an app successful and for getting people involved.

    "You can't just plonk everything online and hope it will automatically work, which I think is what some people do. There are quite a few open classes where the content going online just isn't good enough," he argues.

    MacKerron's Mappiness app is part of the doctoral research being carried out at the LSE's department of geography and environment.

    One of the reasons the numbers using the app far exceeded MacKerron's expectations was the fact that Mappiness was featured in the App Store, which exposed it to a far wider audience than would ordinarily have seen it. However, MacKerron warns that people wishing to launch an app should not bank on getting featured status, as Apple's criteria for bestowing this much sought-after visibility are "very opaque".

    And while he is confident that more research may be done in the future through apps, the benefit gained through a boost in participant numbers is tempered by the fact that it is possible to recruit only iPhone users to the Mappiness project.

    Research in 2010 by Yankee Group, an independent technology research and consulting firm, showed that the average age of a mobile phone user was 40. In contrast, the average age of a smartphone user was 34 when all such devices were taken into account, but this went down to 32 for iPhone users in isolation. In addition, a 2010 study of iPad users by digital marketing analysts comScore found that the largest demographic group was aged 25-34.

    "I don't think there is a way of reaching a more varied cross section of society at the moment," MacKerron explains. "iPhone users tend to be younger and richer, on average, than the average member of society. You can see that in our datasets: 95 per cent of our respondents are under 55."

    All those who have been involved in developing apps agree that academics and administrators alike should also take into account the amount of time a good app takes to build.

    Abrahams estimates that his work on his app took up to 500 hours, including filming, editing and creating quizzes. Creating Mappiness, meanwhile, took up nearly half a year of MacKerron's time, from the beginning of development to its eventual launch in mid-2010.

    Nevertheless, Johnston says that if there is passion behind the idea, the time frame should not deter those wishing to build a new app.

    "It's absolutely fantastic to engage with some new people and I guess that's what I'd say to them: it works. It certainly has for us."

    And MacKerron hopes that one day it will be possible for researchers to access data from existing apps. Apps built by commercial developers often collect a large amount of data. He cites the example of Sleep Cycle, an app that collects information on individual users' sleep patterns and sets an alarm to wake them when they are sleeping at their lightest.

    If the ethical and legal barriers could be cleared, MacKerron suggests, data such as those collected by Sleep Cycle could be used for academic research. "If we could partner other apps, it could create a very interesting research project."

    Before any of this, however, Greer believes that there is another hurdle to overcome: apps suffer from an image problem and can be seen as frivolous by academics.

    "I think that there is a job to be done by people to explain how apps can make things easier and add value to teaching rather than just add to the distractions," he says.

    Not by app alone: mobile phone-friendly websites are essential

    It may be trendy to develop an app, but universities should not rush to do so before getting the basics right.

    That is the view of Michael Fienen, director of web marketing at Pittsburg State University in Kansas, who argues that universities must ensure they have mobile phone-friendly websites before they even think about developing an app.

    A website is likely to be the first port of call for students, but many institutions have yet to develop mobile versions.

    Writing on the .eduGuru blog, Fienen says of developing apps: "If you have the resources, then go for it, but only if you feel you have done everything with a mobile website that you can."

    Fienen warns that ignoring the advent of smartphones will not work.

    "We can no more stop (the internet's) move to our handheld devices...than we can stop a landslide," he says.

    "We cannot complain about the workload. We cannot whine about resources. We have to address it, and we have to nurture it, or we will eventually become a victim of it."

    Describing the idea of a university without a website as "unimaginable", he says that society is just "a stone's throw away" from thinking the same about institutions without mobile websites.

    Michael Fienen's top academic mobile sites

    Virginia Tech

    Massachusetts Institute of Technology

    University of Oxford

    Ohio State University

    West Virginia University

    Core business: Apple leads the market in app sales

    Of the major mobile operating systems offering a platform for app downloads, Apple has far and away the biggest share of the market.

    The App Store, launched in 2008, has facilitated more than 15 billion downloads of almost 500,000 apps and dominates the market, with an 82.7 per cent share in 2010.

    However, there are alternative providers. Google Android has more than 200,000 apps and is favoured by some because its proportion of free apps is so high: nearly two-thirds are free to download, compared with only about a third of Apple's.

    Although official figures put the number of Android apps at 200,000, other estimates have placed it closer to 400,000, with experts confidently predicting that the number available on Android will eclipse Apple in the next month or two.

    BlackBerry's App World has the lowest number of apps of the four major retailers, but it boasts the largest revenue per app.

    Nokia's Ovi Store is currently in the process of a rebrand to join the main Nokia brand. The Ovi Store facilitates about six million downloads a day.

    Each platform charges third-party app developers a host fee. In most cases, this is a one-off, but Apple charges $99 (£62) a year.

    All of the platforms also take a share of the revenue per app - currently 30 per cent, with the other 70 per cent going directly to the developer.

    Where are you and what are you studying? Top scholarly tools

    UK HE Stats

    This app from the Higher Education Statistics Agency features a wealth of data about the UK academy from the 2008-09 and 2009-10 academic years. Information on staff and students can be broken down by country and university. (Free)

    LectureHall

    Building on the Massachusetts Institute of Technology's OpenCourseWare programme, which makes teaching material used in MIT's undergraduate and postgraduate courses freely available, this app aims to provide a "multidimensional" online experience. It provides access to a forum where visitors can leave ratings and reviews of the material. It also allows visitors to download videos for offline viewing - and to take notes and conduct web searches while watching. (Free)

    Layar

    Layar uses "augmented reality" to help people find out more about their surroundings using the cameras on their mobile phones. Several universities use the software in and around their campuses, including the University of Exeter, Edge Hill University, the University of Toronto, Aalborg University and Tilburg University. (Free)

    ImageVis3D Mobile

    One of a number of apps created by researchers at the University of Utah, this app uses images from Utah's Scientific Computing and Imaging Institute. Users can display, rotate and otherwise manipulate three-dimensional images of medical computed tomography and magnetic resonance imaging scans, plus a range of scientific images. (Free)

    Flashcards+

    The most popular of the apps that draw on Quizlet.com's application-programming interface, this is billed as the "first fully functional free flashcard" app. It allows smartphone owners to create their own sets of electronic flashcards, and also gives students the option of downloading Quizlet.com user-created quizzes in a range of subjects, including US college admissions tests. (Free)

    Attendance

    Attendance does exactly what its name suggests: it is designed to help teachers take and keep attendance records. As well as allowing users to add and customise registers for different courses, it also offers a variety of ways to mark attendance beyond the basic absent/present option. (£2.99)

    THE World University Rankings

    This app from Times Higher Education gives easy access to the 200 universities listed in the Times Higher Education World University Rankings, as well as indicative data on a further 200 institutions. In addition to ranked lists, there are individual datasets for each university. Users can search for institutions by using keywords or filters. (69p)

    Mendeley

    Originally launched as a desktop tool to help researchers index and organise papers, Mendeley launched its first iPhone app last year. The app allows iPhone owners to download papers for offline reading and to share citations. However, reviews suggest that the app does not yet have as many functions as the desktop version. (Free)

    All prices are as on the App Store.

    Comment on this story